In Sarzi et al. (2006, MNRAS, 366, 1151) the SAURON team have shown that
extended ionised-gas emission is found in 75% of early-type
galaxies, and comes with a variety of spatial distributions,
kinematic behaviours, and line ratios. Dust absorption features
were found to be always associated with nebular emission, and
the stellar and gaseous kinematics were often found to be
decoupled. The following picture vividly illustrates these
results, which were achieved thanks to the high quality of the
SAURON data and to a
novel procedure to accurately separate the stellar and
emission-line contribution to the observed spectra.
This procedure is available as an IDL code called GANDALF
(Gas AND Absorption Line Fitting), and can be
found here . Please send me
a little e-mail so that
I can keep you updated of upcoming versions of the code and warn
you of any bug I come across
(e.g. a python version is
underway as well as MUSE scripts).
The present version (v1.4) includes reddening by
interstellar dust (the use of which is illustrated
with SDSS data) and also returns
formal errors on the position, width, amplitude and flux of the
emission lines. In the present release you will find example
wrappers that will make use of the pPXF code of Cappellari &
Emsellem (2004) to derive the stellar kinematics. If you decide
to use this code for this purpose, please acknowledge their work
as well.
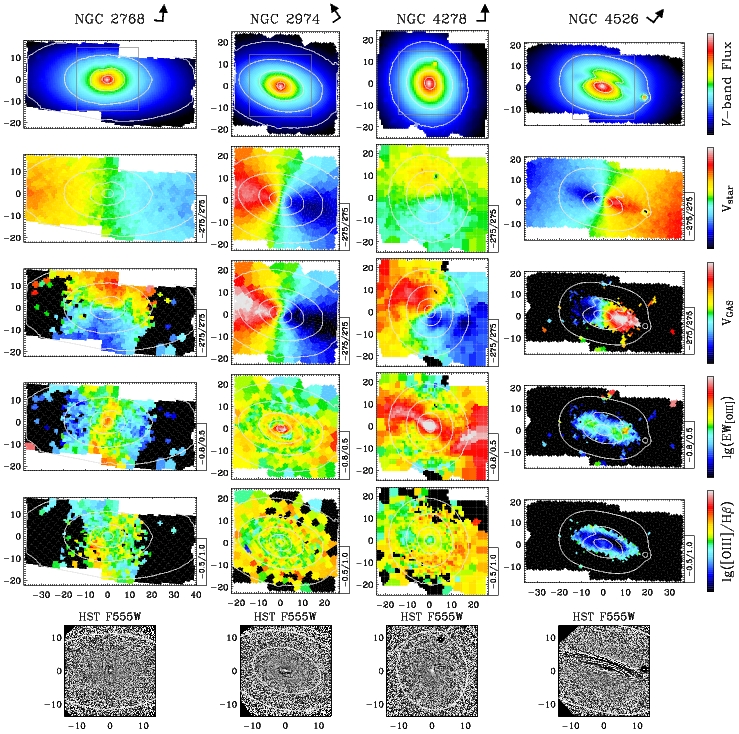
Figure 1: SAURON maps for four
galaxies representative of the gas properties in the 48 E
and S0 galaxies surveyed by the SAURON project (de Zeeuw
et al. 2002, MNRAS, 329, 513). From top to bottom: (i)
the reconstructed total intensity, (ii) the stellar
velocity, (iii) the ionised-gas velocity, (iv) the
equivalent width of the [OIII] emission line in
Angstroms (in log units), (v) the value of the [OIII]/Hb
ratio (also in log units), and (vi) unsharp-masked images
obtained from HST observations. The cuts levels are
indicated in the box at the right-hand side of each
map. The grey boxes on the top figures indicate the
field-of-view of the HST images in the last row. Notice
how the gas distribution can vary from galaxy to galaxy,
and how the kinematic major axis of the ionised gas
deviates from that of the stars. The [OIII]/Hb ratio maps
clearly reveal the presence of radial gradients and
substructures in the ionisation properties of the gas. The
low [OIII]/Hb values corresponding to the dust disk in NGC
4526 suggest ongoing star formation.
Back home
Last modified: Tue Aug 28 10:26:33 GMT 2006